


Four new features to check out
Spreadsheet pros will be pleased with four new features built into Excel 2016 and 2019 — Quick Analysis, Forecast Sheet, Get & Transform and 3D Maps.
Quick Analysis
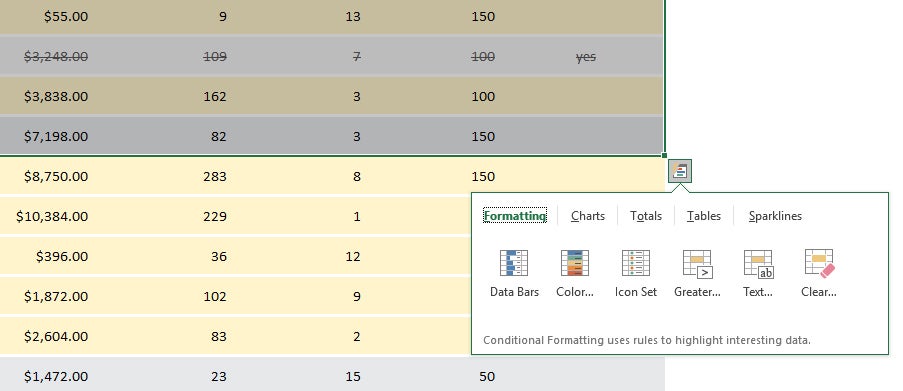
If you’re looking to analyze data in a spreadsheet, the new Quick Analysis tool will help. Highlight the cells you want to analyze, then move your cursor to the lower right-hand corner of what you’ve highlighted. A small icon of a spreadsheet with a lightning bolt on it appears. Click it and you’ll get a variety of tools for performing instant analysis of your data. For example, you can use the tool to highlight the cells with a value greater than a specific number, get the numerical average for the selected cells, or create a chart on the fly.
 IDG
IDG
The Quick Analysis feature gives you a variety of tools for analyzing your data instantly. (Click image to enlarge.)
Forecast Sheet
Also new is that you can generate forecasts built on historical data, using the Forecast Sheet function. If, for example, you have a worksheet showing past book sales by date, Forecast Sheet can predict future sales based on past ones.
To use the feature, you must be working in a worksheet that has time-based historical data. Put your cursor in one of the data cells, go to the Data tab on the Ribbon and select Forecast Sheet from the Forecast group toward the right. On the screen that appears, you can select various options such as whether to create a line or bar chart and what date the forecast should end. Click the Create button, and a new worksheet will appear showing your historical and predicted data and the forecast chart. (Your original worksheet will be unchanged.)
 IDG
IDG
The Forecast Sheet feature can predict future results based on historical data. (Click image to enlarge.)
Get & Transform
This feature is not entirely new to Excel. Formerly known as Power Query, it was made available as a free add-in to Excel 2013 and worked only with the PowerPivot features in Excel Professional Plus. Microsoft’s Power BI business intelligence software offers similar functionality.
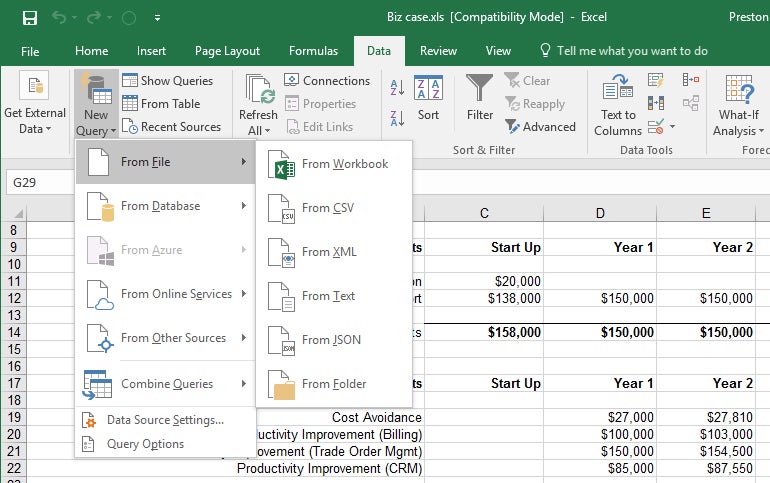
Now called Get & Transform, it’s a business intelligence tool that lets you pull in, combine and shape data from wide variety of local and cloud sources. These include Excel workbooks, CSV files, SQL Server and other databases, Azure, Active Directory and many others. You can also use data from public sources including Wikipedia.
 IDG
IDG
Get & Transform lets you pull in and shape data from a wide variety of sources. (Click image to enlarge.)
You’ll find the Get & Transform tools together in a group on the Data tab in the Ribbon. For more about using these tools, see Microsoft’s “Getting Started with Get & Transform in Excel.”
3D Maps
Before Excel 2016, Power Map was a popular free 3D geospatial visualization add-in for Excel. Now it’s free, built into Excel 2016 and 2019, and has been renamed 3D Maps. With it, you can plot geographic and other information on a 3D globe or map. You’ll need to first have data suitable for mapping, and then prepare that data for 3D Maps.
Those steps are beyond the scope of this article, but here’s advice from Microsoft about how to get and prepare data for 3D Maps. Once you have properly prepared data, open the spreadsheet and select Insert > 3D Map > Open 3D Maps. Then click Enable from the box that appears. That turns on the 3D Maps feature. For details on how to work with your data and customize your map, head to the Microsoft tutorial “Get started with 3D Maps.”
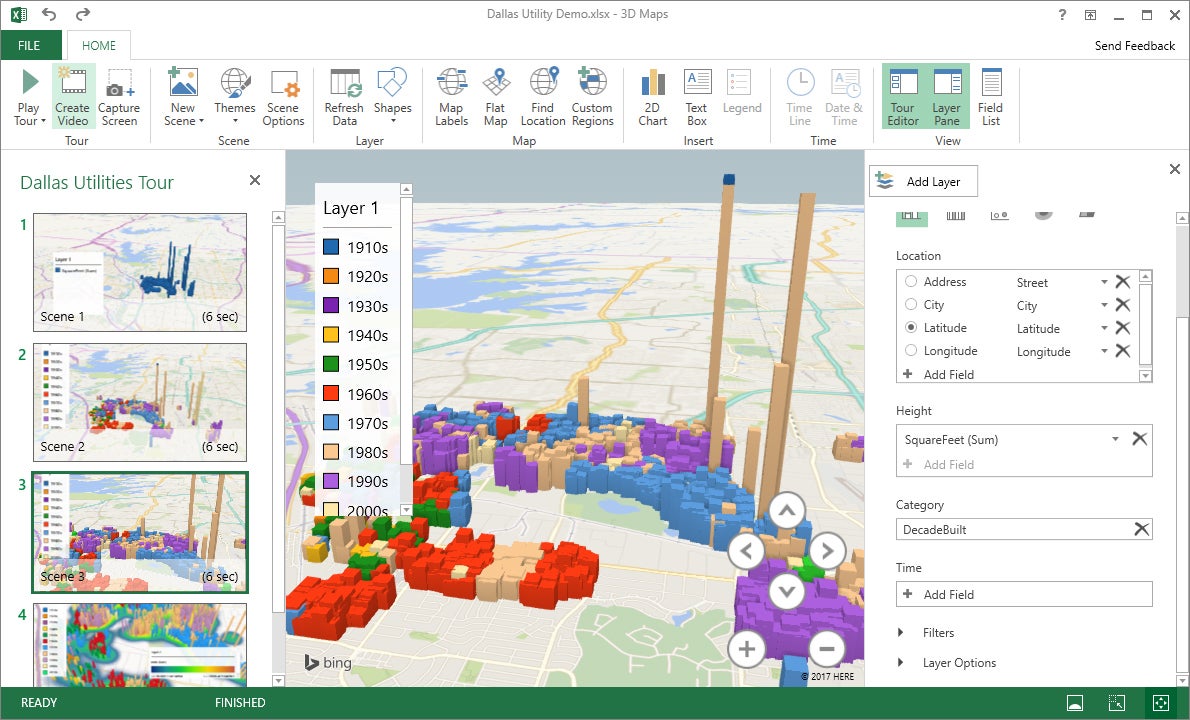
If you don’t have data for mapping but just want to see firsthand what a 3D map is like, you can download sample data created by Microsoft. The screenshot shown here is from Microsoft’s Dallas Utilities Seasonal Electricity Consumption Simulation demo. When you’ve downloaded the workbook, open it up, select Insert > 3D Map > Open 3D Maps and click the map to launch it.
 IDG
IDG
With 3D Maps you can plot geospatial data in an interactive 3D map. (Click image to enlarge.)
New features in Excel 2019
Excel 2019 has a few new features you’ll want to check out, notably two new chart types. Here’s what you should know.
Funnel charts
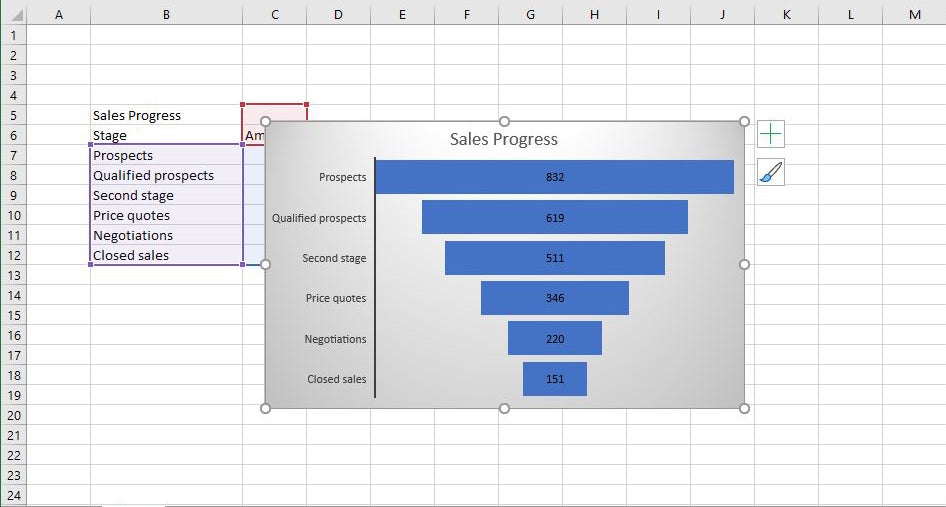
Funnel charts are useful when you want to display values at multiple stages in a process. A funnel chart can show the number of sales prospects at every stage of a sales process, for example, with prospects at the top for the first stage, qualified prospects underneath it for the second stage, and so on, until you get to the final stage, closed sales. Generally, the values in funnel charts decrease with each stage, so the bars in the chart look like a funnel.
 IDG
IDG
Funnel charts, available in Excel 2019, let you display values at multiple stages in a process. (Click image to enlarge.)
When creating the data for a funnel chart, use one column for the stages in the process you’re charting, and a second column for the values for each stage. Once you’ve done that, to create the chart, select the data, then select Insert > Recommended Charts > All Charts > Funnel.
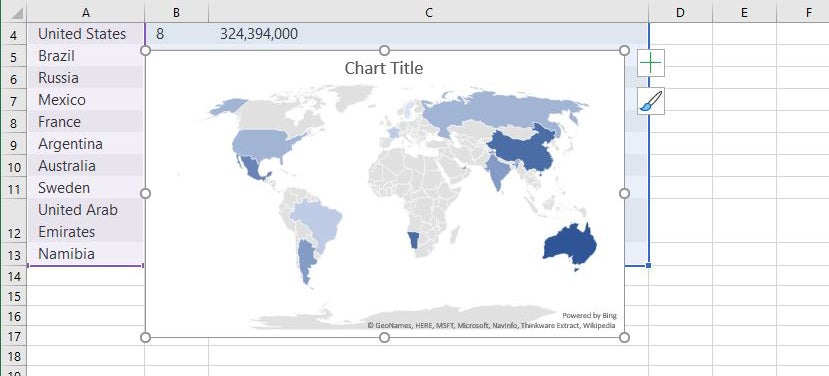
Map charts
Map charts do exactly what you think they should: They let you compare data across different geographical regions, such as countries, regions, states, counties or postal codes. Excel will automatically recognize the regions and create a map that visualizes the data.
 iDG
iDG
Excel 2019’s map charts display data by location. (Click image to enlarge.)
To create a map chart, select the data you want to chart, then select Insert > Maps, then select the map chart. Note that in some instances, Excel might have a problem creating the map — for example, if there are multiple locations with the same name as one that you’re mapping. If that occurs, you’ll have to add one or more columns with details about the locations. If, say, you’re charting towns in the United Kingdom, you would have to include columns for the county and country each town is located in.
New functions
Excel 2019 adds six new functions for doing calculations. TEXTJOIN and CONCAT let you combine text strings from ranges of cells with or without using a delimiter separating each item, such as a comma. You only need to refer to the range and specify a delimiter, and Excel takes it from there. Two other functions, IFS and SWITCH, help specify a series of conditions — for example, when using nested IF functions. And two other new functions, MAXIFS and MINIFS, make it easier to filter and calculate data in a number of different ways.
Functions can be complex to use, and explaining how is beyond the scope of this article. For details about how to use the new functions, head to Microsoft’s helpful “6 new Excel functions that simplify your formula editing experience” post.
Handy keyboard shortcuts
If you’re a fan of keyboard shortcuts, good news: Excel supports plenty of them. The table below highlights the most useful ones, and more are listed on Microsoft’s Office site.
And if you really want to go whole-hog with keyboard shortcuts, download our Excel 2016 and 2019 Ribbon quick reference guide, which explores the most useful commands on each Ribbon tab and provides keyboard shortcuts for each.
Useful Excel 2016 and 2019 (in Windows) keyboard shortcuts
Ready to delve deeper into Excel? See our “11 Excel tips for power users.”
This story was originally published in May 2016 and updated in Feb. 2019 to include Excel 2019 features.
![Computerworld Cheat Sheet > Microsoft > Word [2016 / 2019]](https://images.idgesg.net/images/article/2020/06/cw_microsoft_2016_2019_word_cheat_sheet_2400x1600-100849337-small.3x2.jpg?auto=webp&quality=85,70)
![Computerworld Cheat Sheet > Microsoft > Excel [2016 / 2019]](https://images.idgesg.net/images/article/2020/06/cw_microsoft_2016_2019_excel_cheat_sheet_2400x1600-100849339-small.3x2.jpg?auto=webp&quality=85,70)
![Computerworld Cheat Sheet > Microsoft > PowerPoint [2016 / 2019]](https://images.idgesg.net/images/article/2019/02/cw_microsoft_2016_2019_powerpoint_cheat_sheet-100787134-small.3x2.jpg?auto=webp&quality=85,70)
![Computerworld Cheat Sheet > Microsoft > Outlook [2016 / 2019]](https://images.idgesg.net/images/article/2020/06/cw_microsoft_2016_2019_outlook_cheat_sheet_2400x1600-100849338-small.3x2.jpg?auto=webp&quality=85,70)